Note : This article is the 1st in a series on how the internet and globalization are disrupting nation-states—and what new governance models may emerge. Here are the first articles in this series:
Since the beginning of this second part, I have offered you individual solutions to help you succeed. But we are social animals, and we also need effective social models to live together in the best possible way.
Scientifically experimenting with models of governance
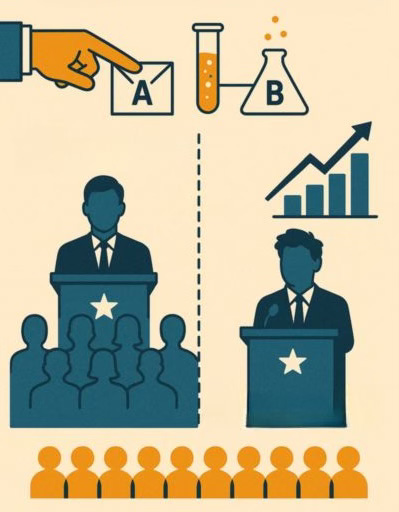
In marketing, a simple method to find out whether one email subject line or sales page works better than another is to do an A/B test.
A/B Testing Governance Models
What does this test involve? It’s simple: showing two variations of the same page, advertisement, email, etc. to a given audience and measuring which version performs better.
It’s a simple, scientifically established methodology for identifying which elements perform best1 .
Now, imagine if we could do this with political and economic systems—in short, systems of governance: we present a percentage of the population of a given country with governance model A and the remaining percentage with governance model B, then, a few decades later, we come back to measure which governance model has brought the most prosperity.
That would be great, wouldn’t it?
Well, the good news is that tests of this kind have already taken place in history... although generally not intentionally.
Let’s look at some historical examples of these governance experiments
I’m focusing on GDP per capita, although other metrics are possible. But generally, the higher a country’s GDP per capita, the richer it is, and the higher the quality of its infrastructure, education, healthcare, etc.
Conversely, the lower a country’s GDP per capita, the shorter its life expectancy, the more difficult its jobs, and the more limited its access to basic services such as running water and electricity throughout the day, as well as entertainment, etc.
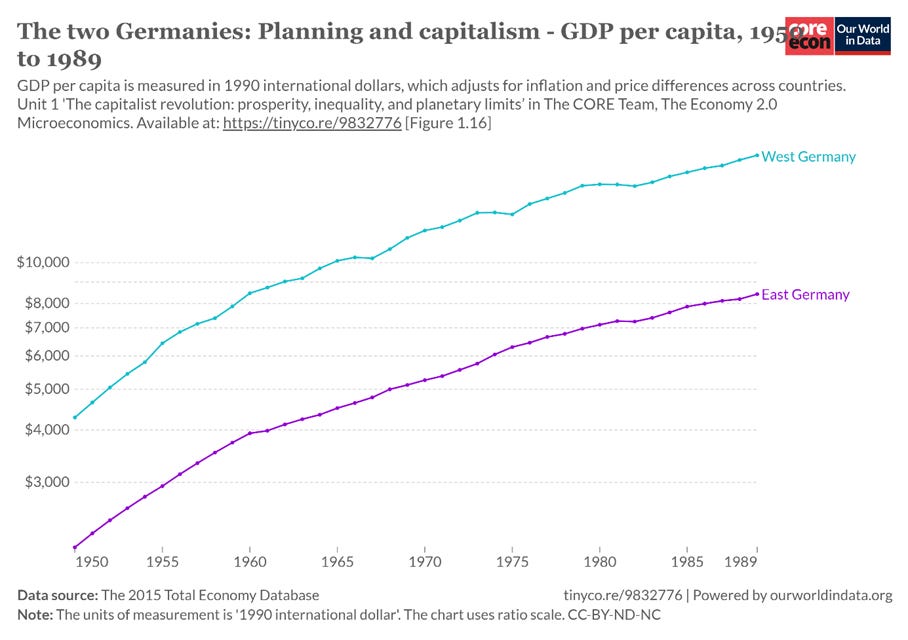
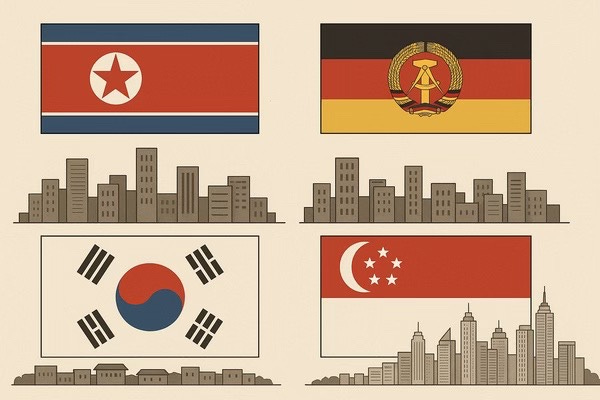
Germany
Germany was divided between West Germany (occupied and later liberated by the Americans) and East Germany (under Soviet rule) between 1945 and 1989.
Per capita GDP of West Germany in 1989: $18,016, an increase of 321%
East Germany’s GDP per capita in 1989: $8,422, an increase of 301%3
It is also interesting to examine what happened after reunification4 :
East Germany’s GDP per capita jumped in the eight years after reunification, before returning to a similar growth rate as before, albeit at a higher level.
Thanks for reading Disruptive Horizons! Subscribe for free to receive new posts about how nation-States are disrupted by the Internet and Globalization, and how to transform from a Mono-Country to a Netizen Without Borders :
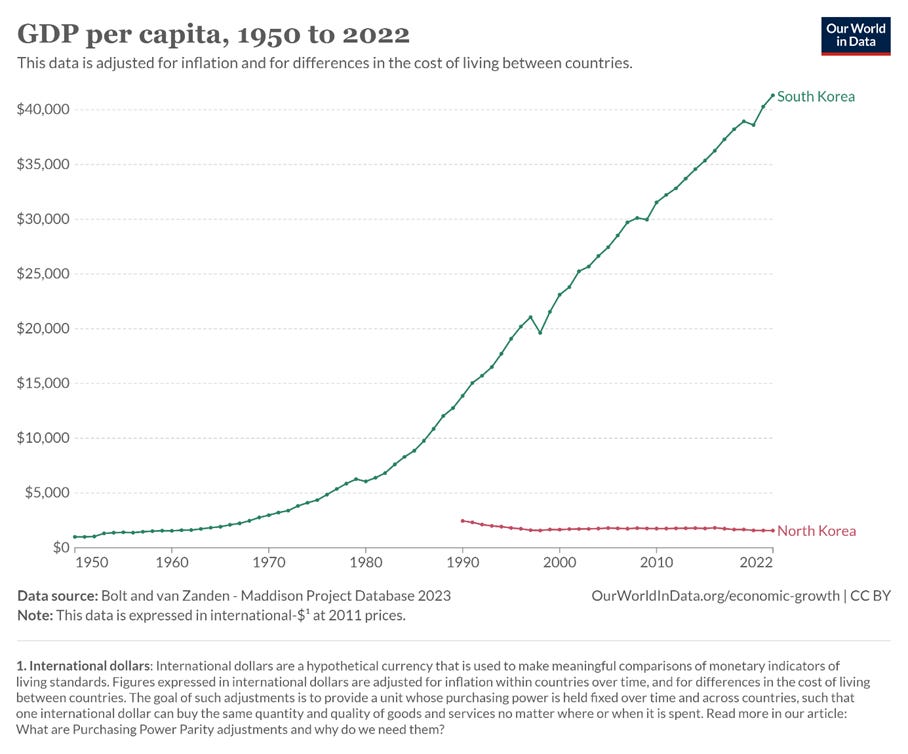
Korea
Korea was divided into North Korea and South Korea following the Korean War in 1953.
South Korea’s GDP per capita in 2022: $41,3216 , an increase of 2713%
North Korea’s GDP per capita in 2022: $1,569, an increase of 6.81% (!)
This chart only began in 1990 for North Korea, but its real GDP per capita actually started at the same level as South Korea in 19507 .
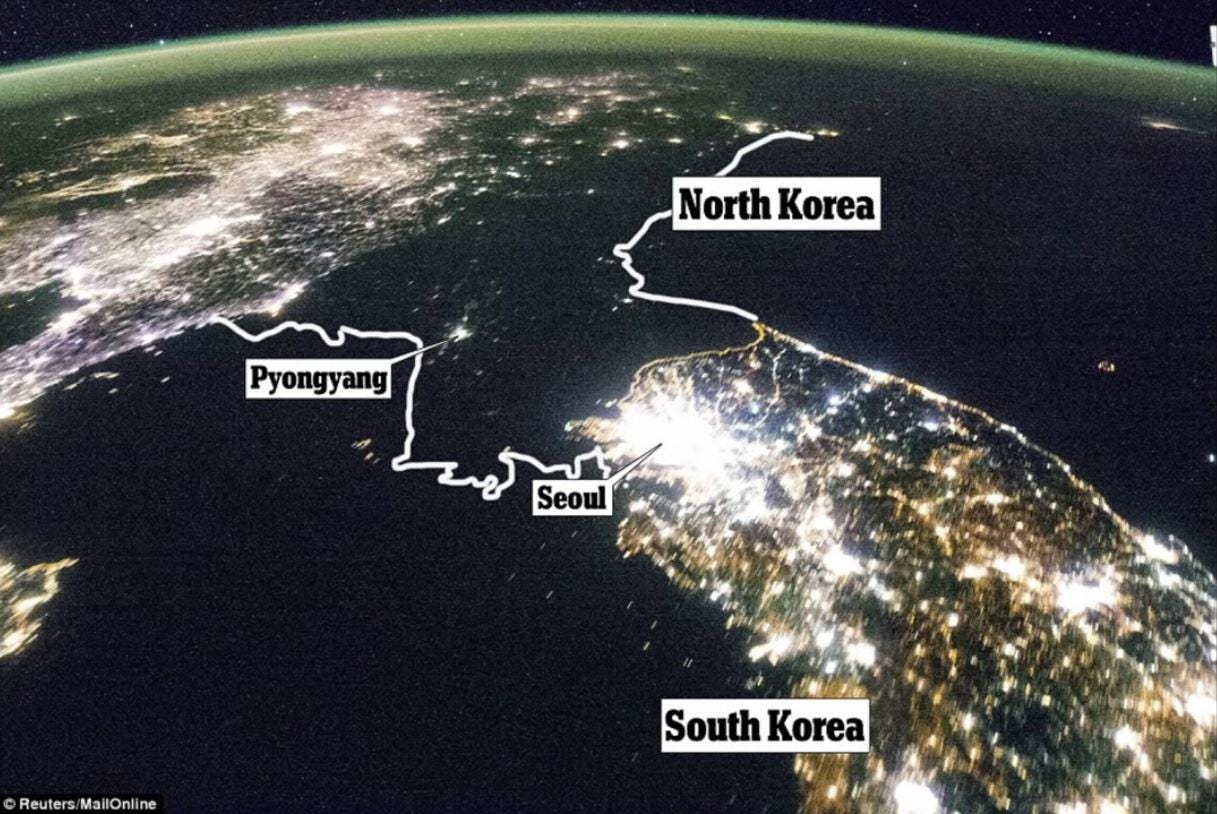
Of course, that famous photo of South Korea vs. North Korea at night is worth a thousand words.
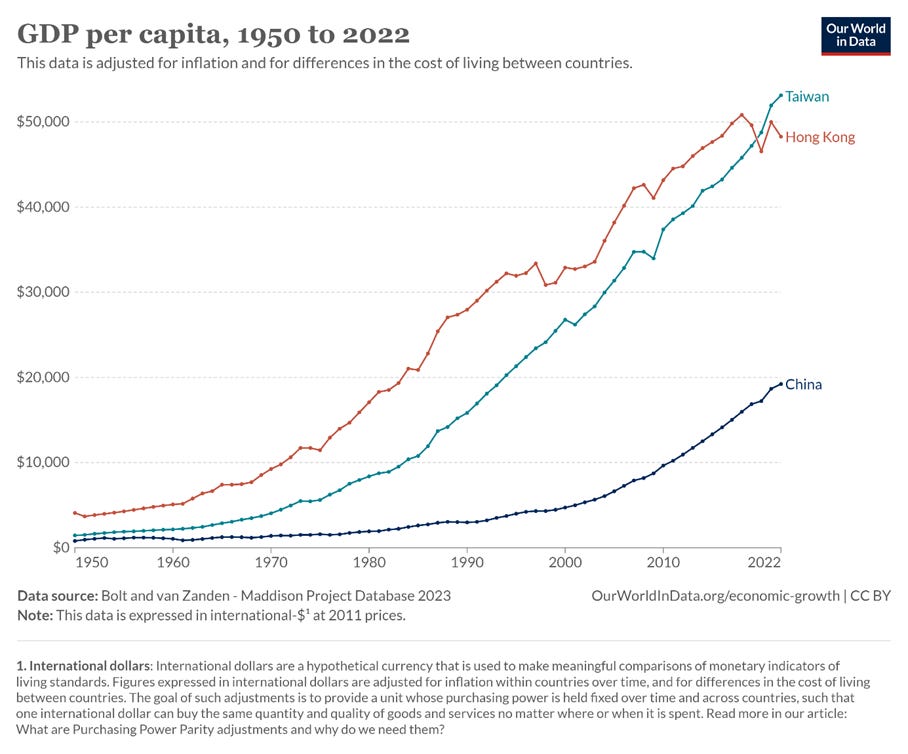
Taiwan
Separated from China following the Chinese Civil War in 1950. Let’s also compare with Hong Kong, a British colony with Chinese culture until its return to China in 1997, then a Chinese territory governed according to the “one country, two systems” principle for good measure.
Taiwan’s GDP per capita in 2022: $53,143, an increase of 3,540%
Hong Kong GDP per capita in 2022: $48,289, an increase of 1,083%
China’s GDP per capita in 2022: $19,238, an increase of 2,308%
Note how Hong Kong’s growth came to a screeching halt after the 2019 riots and the ensuing Chinese crackdown.
We will comment on China’s curve a little further down.
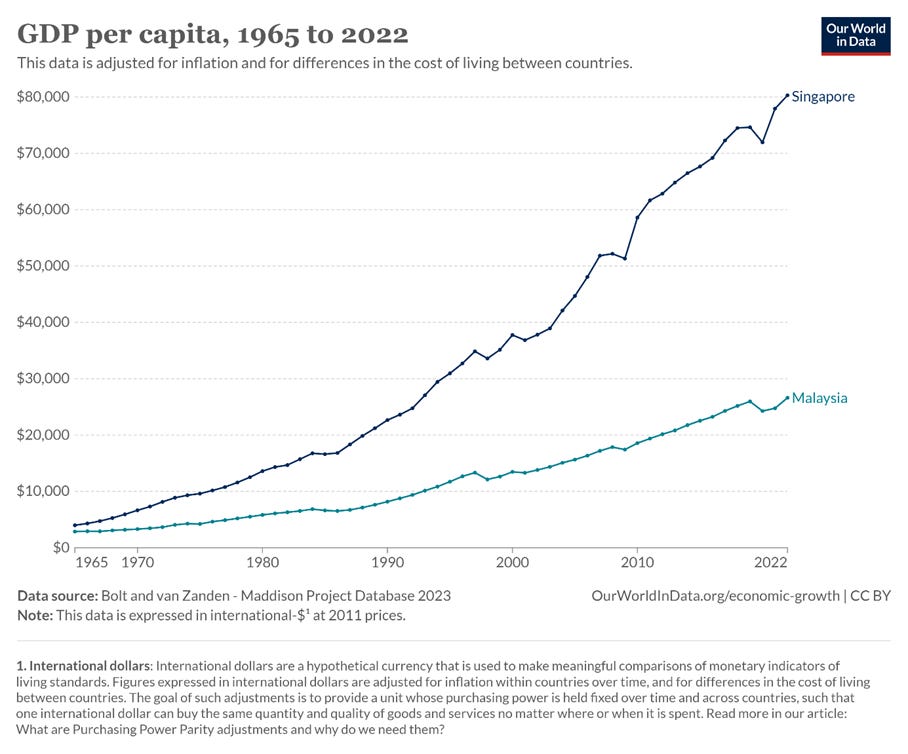
Singapore
Expelled from the Federation of Malaysia in 1965, two years after joining, following a unanimous vote in parliament, making it the only country in the world to have become independent against its will.
Singapore’s GDP per capita in 2022: $80,320, an increase of 1,913%
Malaysia’s GDP per capita in 2022: $26,629, an increase of 826%
What do we learn from looking at these A/B tests?
We see countries that share the same history, culture, and language10 , and which were primarily divided by war (and independence against its will for Singapore).
And we also see major differences in wealth after a few decades. So what made the difference?
Governance comparison with A/B Test
Many factors can be eliminated, or at least reduced, due to the relatively similar starting conditions.
Admittedly, there are geographical differences and starting conditions that sometimes diverge somewhat in economic terms, as can be seen in the initial GDP per capita.
But ultimately, what really made the difference were the systems of governance. In each case, one political and economic system clearly demonstrated its superiority over the “rival” system.
There is no doubt, for example, that if the North Korean government had administered the territory of South Korea, and vice versa, there would be a similar but reversed disparity between the two Koreas today: North Korea would be much richer than South Korea.
The wealth of data generated
Tests of this kind are extremely informative, as attentive observers can simply study the system that works better than the other and try to replicate it.
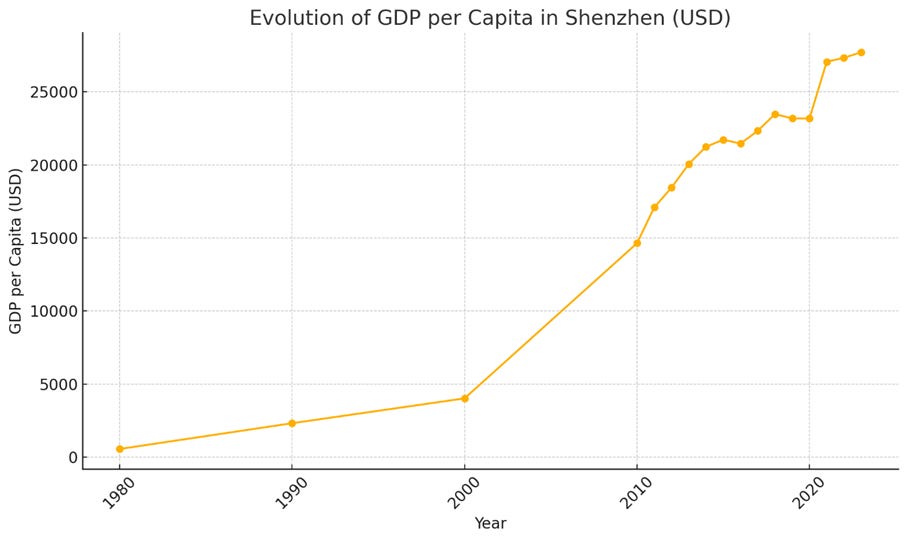
For example, it was after observing the success of Hong Kong that the Chinese government decided to set up a test economic zone in Shenzhen in the early 1980s11 .
Given Shenzhen’s considerable success, the Chinese government decided to liberalize its economy from the middle of the decade onwards, and especially from the early 1990s onwards13 .
Look again at the Chinese growth curve and note how, while it stagnated or grew slowly until that period, it began to rise sharply from the early 1990s onwards.
Without this experiment, which was then extended to the rest of the country, the current wealth gap between China on the one hand and Taiwan and Hong Kong on the other would be even more pronounced than it is today.
It has therefore been demonstrated that certain countries can take advantage of these tests to develop much faster than before.
However, these tests pose two major problems:
They were carried out against the will of the population in each case.
Such experiments have been too few and far between.
Now imagine systems of governance being tested without war or revolution.
Now imagine that we could experiment with systems of governance, but without war, without revolution, without forcing a minority of people who do not want to be subjected to the tyranny of the majority.
And imagine that we could conduct not just a few tests here and there, but hundreds, thousands of tests.
A utopia?
Not at all. It already exists. But before explaining this new model of society, we must first talk about...
Coming soon
In the next article, we’ll take a look at how Nobel Prize–winning economist Paul Romer proposed the concept of charter cities — experimental zones designed to test new governance models and help developing countries escape poverty.
If you’ve made it this far, then you’ve probably enjoyed this article. If yes, feel free to subscribe for free to receive new posts about how nation-States are disrupted by the Internet and Globalization, and how to transform from a Mono-Country to a Netizen Without Borders :
For Singapore and Malaysia, it is a little more complicated, as Singapore has four official languages, including Malay, the language of Malaysia, which is also the national and historical language of the city-state. But English is the real lingua franca.
Couldn't agree more; the imperative to scientifically experiment with social models has never been more evident, especially considering how rapidly digital tools are resaping our collective structures.


Such a good intro. If only charter cities were real! I’d love to see many metropolitan areas become charter cities and see what happens!
Couldn't agree more; the imperative to scientifically experiment with social models has never been more evident, especially considering how rapidly digital tools are resaping our collective structures.