State indebtedness is at an all-time high
So little room for manoeuvre as disruptive forces converge
Note : After the 14-part series in which we looked at how nation-states are being disrupted by the Internet and globalization, here is the 4-part series on on why now is the worst time for them, of which this article is the 3rd :
Today we're going to look at another major problem: many countries have a level of debt relative to GDP not seen since the Second World War.
Why a high level of public debt is bad for the economy ?
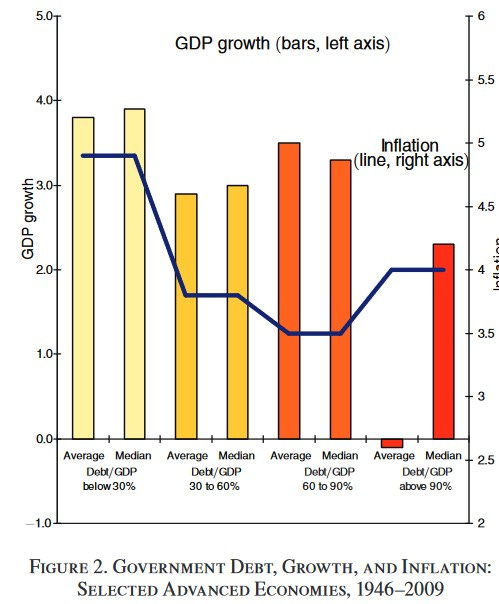
This is already having an impact on countries' economies: in 2009, a study by researchers at Harvard University and the University of Maryland showed that debt in excess of 90% of GDP slows growth by around one point a year1 .
Another study has refined this measure, showing that each point of debt above 77% reduces growth by 0.017 points per year2 (and 0.02 from 64% in developing countries).
This may not sound like much, but it's actually enormous, due to the power of "compound interest" as it applies to lost economic development, which is growing every year.
So if a developed country is indebted to the tune of 100% of its GDP, which is 22% above the threshold, this slows economic growth by 0.39% a year.
If it remains at this level of debt for several years, and would have average growth of 2% a year with debt below the threshold, this has a cumulative effect:
After 10 years, this country's GDP will be 4.06% lower than it would have been if the debt had been 77% or less (i.e., for a country like France with a GDP of 2,500 billion euros in 2021, a loss of 115 billion euros for the economy every year, or tens of billions of euros less in tax revenue every year).
After 20 years, this country's GDP will be 11% lower (i.e., for a country like France, a loss equivalent to 274 billion of 2021 GDP each year, since any unrealized growth is carried over from one year to the next).
And for good measure, here's another simulation for the USA :
You start to get the picture.
This is largely why the Maastricht Treaty, which established the European Union in 1992, stipulates that member countries :
May not exceed an annual deficit of 3% of GDP
May not have a public debt exceeding 60% of GDP
As we shall see, these figures are so poorly respected as to be ridiculous, to the point that in 2005, an "exceptional and temporary" overshoot was authorized3.
And, as is so often the case, it was an "exceptional and temporary" situation that continues to this day. This just goes to show how tempting it is for most governments to go into debt.
In addition to the deleterious effects on the economy, a high level of debt reduces a country's room for maneuver, because :
The higher the debt, the greater the interest payable on that debt (this may vary according to the interest rate on the loans taken out, but is a rule generally observed).
In France alone, for example, the cost of interest on debt was 53.2 billion euros in 20224 . By way of comparison, corporate income tax brought in 40 billion euros for France in 20225 .
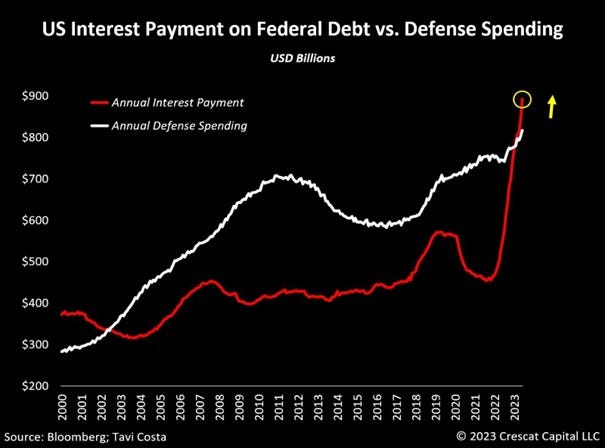
In the United States, the cost of debt ($870 billion) is greater in 2024 than the US defense budget ($822 billion)6.
The higher the level of debt, the less confidence investors have in the lending state: heavy debt increases the risk of default. To compensate and continue to attract investors, the lending state must increase the interest rates it grants, which in turn increases the cost of debt - it's a downward spiral.
How bad is the situation today ?
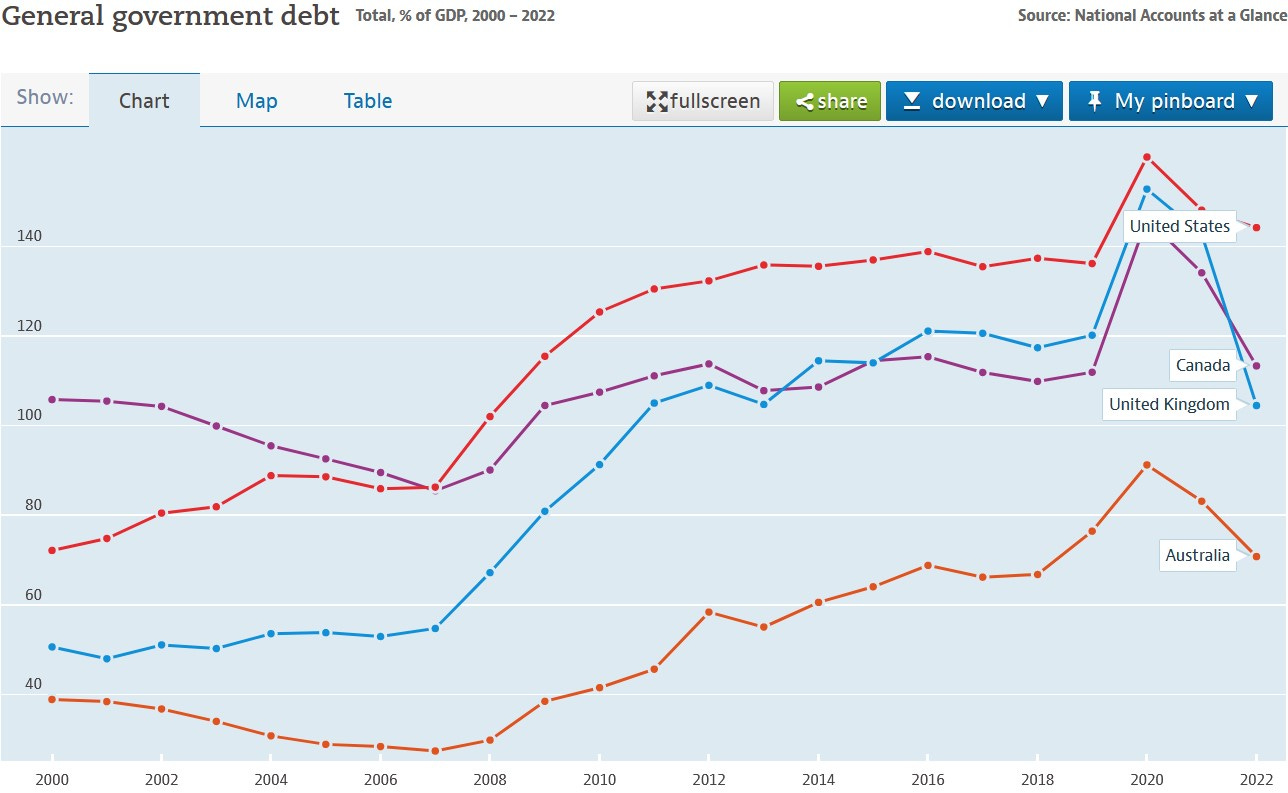
Let's take a look at the situation in 4 major English-speaking countries countries:
And here are the data for 2000 and 2022 in table form7 :
As you can see, only Canada remains more or less stable, but with a debt level that remains above 100% of GDP, with all its deleterious effects shared above. Debt levels in Australia, Great Britain and the United States have almost doubled, or doubled.
Only Australia has a debt level below the recommended 77% upper limit.
Admittedly, 2020 and 2021 are special years due to COVID, but by 2022 these 4 countries have returned to their approximate pre-pandemic debt levels.
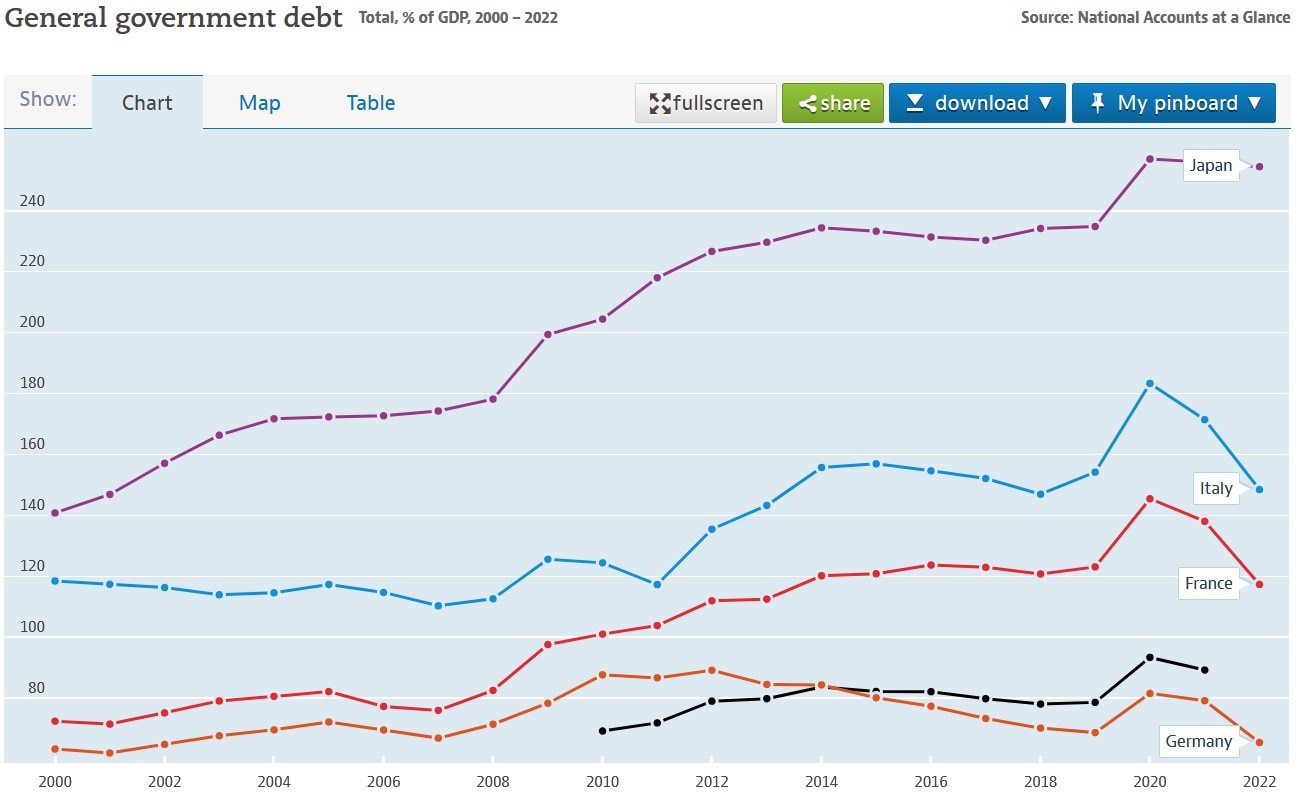
Compare these figures with the other G7 countries (the richest democratic countries):
The black line represents the average indebtedness in the OECD (the 38 richest democratic countries).
As you can see, only Germany was doing well in 2022, and the average debt level of OECD countries is 89% of GDP, 12% above the fateful threshold explained above.
In other words, most rich countries have very little room for manoeuvre. They have been living beyond their means for decades, and many have reached a level of debt that is slowing down their economic development.
And as we saw with the example of Liz Truss, this reduced room for manoeuvre can even have a direct influence on democratic mechanisms, as in this case the markets judged Liz Truss's project to be economically unfeasible given Britain's debt levels, even though her party had elected her.
And a special mention for Japan, which has the world's highest debt, representing more than two years of the country's annual wealth, even as its population ages and shrinks at an accelerating rate8. This is partly offset by the fact that the vast majority of this debt is held by patriotic Japanese who lend to their government at low rates, and substantial foreign exchange reserves9, but how long can this last?
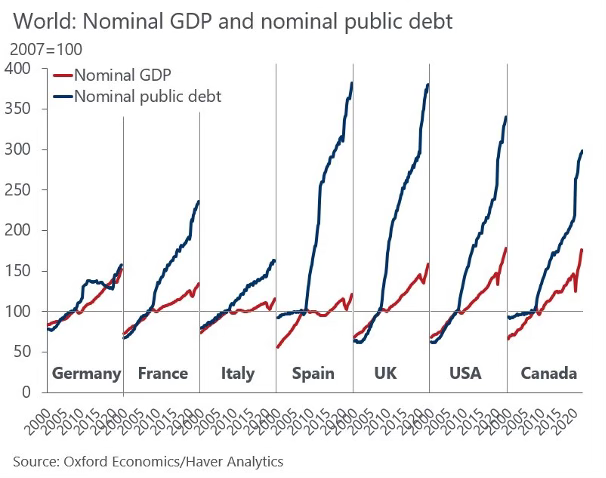
And take a look at this diagram below, showing the evolution of GDP in 7 developed countries, compared with their debt ratios, relative to a 2007 baseline: it's easy to see that their debt is growing much faster than their GDP, with the exception of Germany.
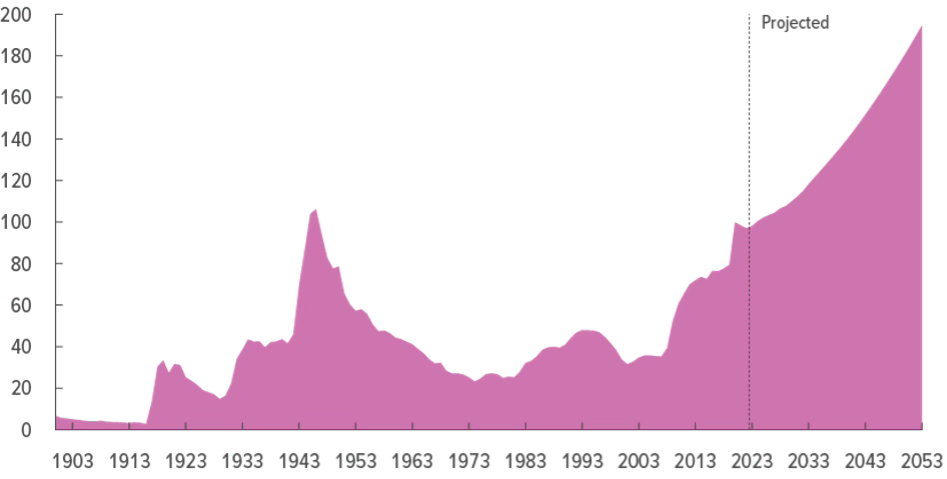
And here's the evolution of the US debt-to-GDP ratio, historical up to 2023, then projected, calculated by the very official Congressional Budget Office10 :
And here is the projection of the cost of the debt, by the same very official office11:
The "Net Interest Outlays" in blue represent the cost of debt: as you can see, it is expected to account for a growing share of the annual US budget deficit.
It's even worse when you look at the real debt ratio
When an individual borrows, a bank will look at their debt ratio: the amount they have to pay each month in expenses compared to their salary.
So if an individual earns €2,000 a month, has to pay back €500 on his apartment, and has incompressible costs of €250 (insurance, petrol, electricity, etc.), he has a debt ratio of 37.5%.
In France, banks generally avoid lending to people with a debt ratio in excess of 35%, unless they have sufficient "reste à vivre" (the net sum available after repayment of monthly installments).
Here, the important point is that the bank looks at the individual's income: not the income of his or her company, or of the neighborhood in which he or she lives.
Similarly, for a business loan, a bank will look at many parameters, but above all will not stop at sales alone, and will also take a (very close) interest in the company's profit and other parameters such as growth.
Why am I telling you this?
Because I've always found it odd to talk about a country's debt in relation to its GDP... as if a government collected 100% of the value generated by the economy!
Talking about debt in relation to GDP has the same meaning as talking only about a company's debt in relation to its sales, i.e. it's an imprecise relationship at best.
GDP represents the total gross income that could be obtained by a state that taxed its economy at 100%, which 1) is impossible, because if a state even tried to come close to this, it would drive away a large number of businesses, and through this and other mechanisms, completely crash its economy, and 2) if it even managed to do this (which, remember, is impossible), it would enormously increase its spending at the same time, since it would have to take care of its entire population so that they didn't starve: its net income would therefore never be 100%.
Of course, lenders don't just look at this ratio, and consult many other parameters, but curiously, nowhere did I find the ratio of general indebtedness to net tax income.
Also, many economists like to say that "the state is not a household, and should not be run as one".
Okay, but when all is said and done, a state doesn't pay off its debt with its GDP, it does it, when it manages to do so, with its tax revenues.
So why not compare a country's debt levels with its tax revenues? In the worst case, it would be an interesting exercise.
Let's take a look at the debt levels of a few countries in relation to their tax revenues.
Note that this is only an indication, as the standards for calculating tax revenues and indebtedness may differ between each country, and their harmonization has been a goal for decades, progressing at a snail's pace12 .
Let's take a look at the debt levels of a few countries in relation to their tax revenues13.
References for the debt/GDP14 for : Canada15, France16, Switzerland17, UK18 and USA19.
Conclusion : so little room for manoeuvre as disruptive forces converge
Whether we look at debt levels in relation to GDP, or in relation to income, one thing is certain: most countries in the world are now up to their necks in debt, at levels rarely seen before in their history, apart from during periods of total war.
For the moment, most of them are managing to kick the can down the road, but for how long will this be possible?
I mean, look again at this graph, and tell me how long it can go on :
This fact shows a real headlong rush forward, characteristic of a situation that eludes governments and a corruption of the principles of sound economic management that were the norm before the 70s.
Without spectacular economic growth and/or spending cuts, which would enable them to stop running deficits every year and use the surpluses to reduce their debt, or equally spectacular inflation, which would enable them to reduce the real value of their debt, most countries will one day have to live with the consequences of their mismanagement: with the annual cost of their debt rising to unsustainable levels, and one day probably default, with all the devastating consequences this would have on investor confidence and the ability of states to borrow again.
And remember: the higher the level of debt, the greater the bad impact on economic growth.
All this at a time when all the disruptions we mentioned earlier are coming, and some crypto-currencies are becoming asset classes in their own right, which could well one day compete with government bonds when it becomes increasingly obvious to investors that these bonds are becoming riskier and riskier.
All the factors we've seen in this series show that many countries are going to have to increase their revenues and reduce their spending, i.e. their populations will be entitled to more taxes and fewer services: we'll see in the next article the coming disorders this will bring.
In the meantime, feel free to follow Disruptive Horizons on Twitter, and join the tribe of Intelligent Rebels by suscribing to the newsletter :
The series on how this is the worst time for nation-states to be disrupted
This article is the 3rd in a series on the worst moment for nation-states.
Here are the first two articles in the series:
And the next one :
"Growth in a Time of Debt", Carmen M. Reinhart and Kenneth S. Rogoff, 2010
"Finding The Tipping Point - When Sovereign Debt Turns Bad", Thomas Grennes, Mehmet Caner, Fritzi Koehler-Geib, 2010
"Budget de l'État", French Ministry website
“Do We Spend More On Interest Than Defense?”, US Budget Watch 2024
“General government debt”, OECD, 2022
Japan's population has been falling every year since 2010, at an accelerating rate, "Japan's population drops by nearly 800,000 with falls in every prefecture for the first time", Gavin Blair, The Guardian, 2023
1,170 billion in December 2023, or around 12% of its public debt of $9,396 billion.
"The Budget and Economic Outlook: 2023 to 2033", Congressional Budget Office, 2023
« The 2023 Long-Term Budget Outlook”, Congressional Budget Office, 2023
“L’harmonisation comptable des administrations publiques : une analyse comparée internationale", Eugenio Caperchione and Elisa Mori, Politiques et Management Public, 2013
Methodology: first, I went straight to the sources, consulting the official publications of the countries concerned on their tax revenues. However, I came up against the fact that the standards for calculating tax revenues and debt may differ between each country, and that harmonizing them has been an objective for decades, progressing at a snail's pace (see « L’harmonisation comptable », Eugenio Caperchione et Elisa Mori, Politiques et Management Public, 2013)For example, there was a big disparity in the figures reported by France (294.3 billion euros of tax revenue in 2023) and Great Britain (£788 billion), which didn't make sense given how close these countries' GDPs were.
Digging deeper, I realized that this was due to two factors:
- The tax revenues communicated by France are net revenues, which makes a 1st important difference: in 2023, France's gross revenues were 470.6 billion euros, compared with 294.3 net. The UK doesn't communicate whether its figures are gross or net. I assume they are gross.
- The UK includes social security contributions in its tax revenues, which France does not.
As you can see, directly comparing the situations of different countries is not easy. So what I did was to take the percentage of compulsory deductions in relation to GDP calculated by the OECD ("Tax revenue", the OECD is aware of the disparities between countries' calculation methods and ensures that its calculation methodology is the same for everyone), and calculate how much this represents in volume by simply multiplying the GDP communicated by the country in question by the percentage of compulsory deductions, in the country's currency.
So for France: GDP of 2,639 billion euros in 2022 multiplied by 46.08% of compulsory deductions in relation to GDP = 1,216 billion euros in compulsory deductions.
"General government debt, OECD, 2022
« Produit intérieur brut, en termes de revenus, provinciaux et territoriaux, annuel (x 1 000 000) », website of the Canadian governement
"Budget de l'État", official government website, "suivi d'exécution mensuel" section for December 2022, "À la fin du troisième trimestre 2023, la dette publique s'établit à 3 088,2 Md€", INSEE, which contains the 2022 figures.
« Economie nationale », website of the Swiss governement
« Gross Domestic Product: chained volume measures: Seasonally adjusted £m”, website of the British governement
« Gross Domestic Product », website of the American governement


