Erratum about "State indebtedness is at an all-time high"
Errare humanum est, perseverare diabolicum
I've updated the article “State indebtedness is at an all-time high” following a few errors I spotted.
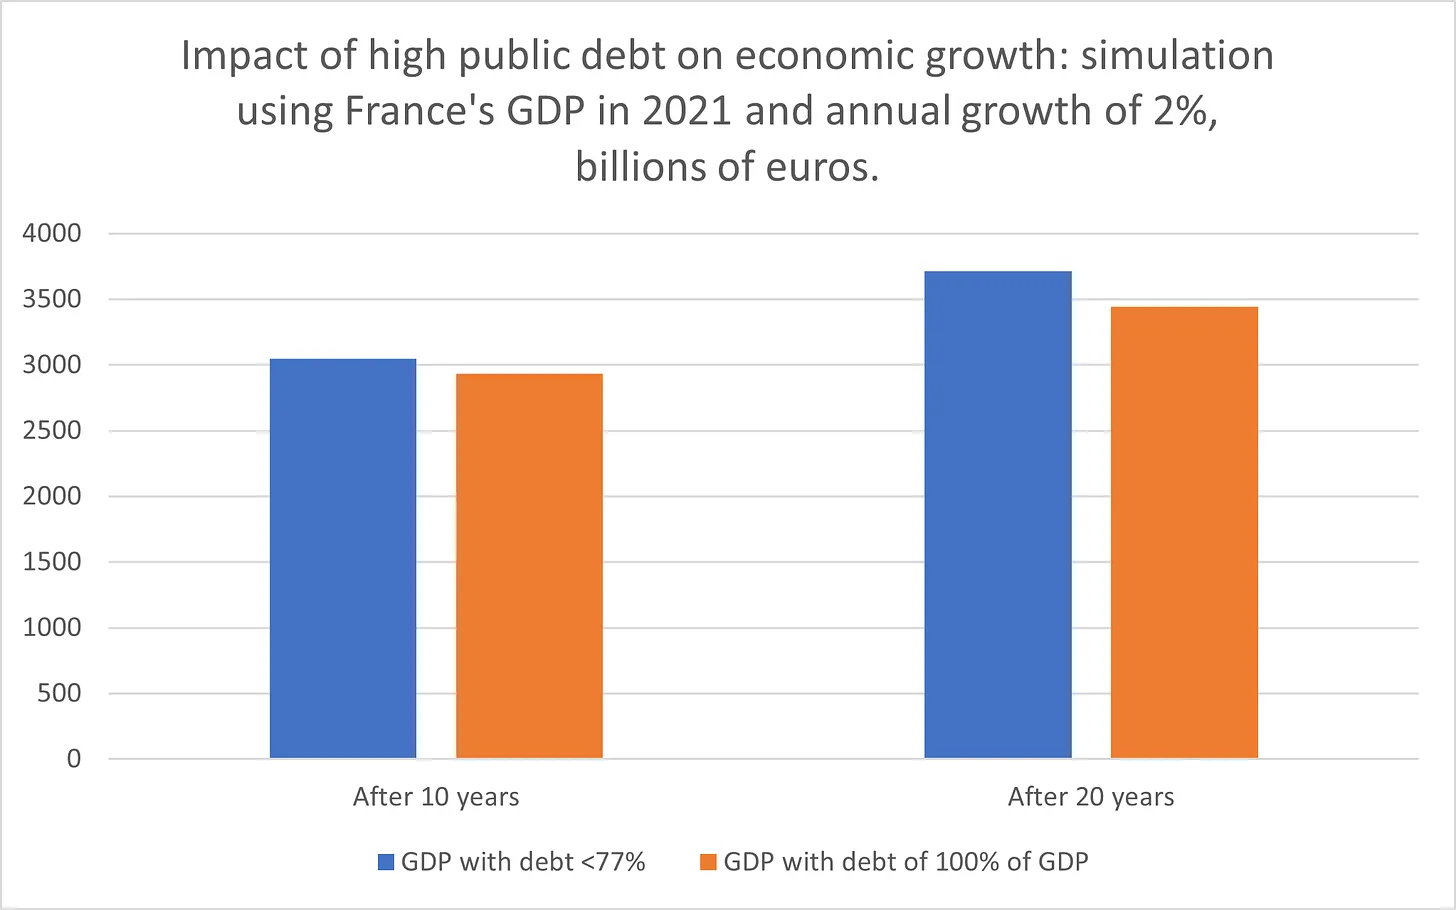
Beyond the little errors that crept in here and there, such as the fact that these diagrams had an incorrect caption "GDP with debt >77%" instead of "GDP with debt 100% of GDP" :
I noticed that I had made a methodological error regarding the data in this table:
when someone on one of the Telegram groups on which I share my articles remarked:
And I answered this :
“I wouldn't attach too much importance to these differences. As I note in the article, each country makes its calculations differently, which makes direct comparison difficult.
I've just dived back into the official reports on tax revenues for France and the UK to better understand this difference, which doesn't seem to make much sense (tax revenues in France were equivalent to 47.3% of GDP in 2021, compared with 34.3% for the UK).
And this is due to two factors:
- France's tax revenues are net revenues, which makes the 1st major difference: in 2023, France's gross revenues were 470.6 billion euros, versus 294.3 net. The UK does not communicate whether its figures are gross or net. I assume they are gross.
- GB includes social security contributions in its tax revenues, which France does not. Social security contributions in France in 2023 were 342 billion euros, so if we add that to the 470.6 billion euros gross in tax revenue, we get 812 billion euros in revenue, roughly the same level as the 788 billion pounds of GB indicated in my article.
I should probably update the GB figure by removing social security contributions, but that would mean checking whether or not they are included in other countries' revenues, which would take a lot of time.
As you can see, directly comparing the situations of different countries is not easy. Maybe I'll remove this comparison with individual/company income in my article and book for this reason, or just take the OECD's tax-to-GDP ratio, which is supposed to take all these differences into account in its calculations.”
So in the end I just decided to use this methodology to redo the calculations: what I did was to take the percentage of compulsory deductions in relation to GDP calculated by the OECD ("Tax revenue", the OECD is aware of the disparities between countries' calculation methods and ensures that its calculation methodology is the same for everyone), and calculate how much this represents in volume by simply multiplying the GDP communicated by the country in question by the percentage of compulsory deductions, in the country's currency.
So for France: GDP of 2,639 billion euros in 2022 multiplied by 46.08% of compulsory deductions in relation to GDP = 1,216 billion euros in compulsory deductions.
The result is the following table, now in the article in place of the old one:
As you can see, this changes the data somewhat, even though the previous data was directionally correct and what I meant (the debt to tax revenue ratio is much worse than the debt to GDP ratio) is indeed confirmed by this new data.
I'm very happy to have been able to make this correction: without this remark, I might not have paid attention to this methodological error before publishing the book. I thanked this person directly in the group for this.
It also shows that the 2nd major objective for which I started this blog, which I shared in “Why I'm writing this Substack” and “Review of Disruptive Horizons in 2023”, “I'd also like to put my ideas in the "boxing ring of ideas", to get feedback and criticism (constructive, I hope!) to flesh out the concepts before publication in book format”, is working.
Thanks to you readers for helping me improve, and ensuring that the book's content is backed by the best possible data! :)
If you see other problems in the data I'm sharing, or even in their interpretation, please don't hesitate to share them with me in comments, that's a big reason why I write this blog!


